
Q2 2026 Data Talk: 3 Takeaways to Power Your Leasing Strategy Through The End of The Year
Q2 2026 delivered a strong leasing environment for many property managers, and ShowMojo customer data shows it.
This quarter, nearly 58% of inquiries turned into scheduled tours, and 419,763 tours were completed, which were both ShowMojo records.
What’s driving that isn’t showing format or market conditions. It’s response speed, and the gap between fast and slow is wider than most teams assume (more on that later).
Our latest Data Talk draws on more than 1.7 million leased units, 25 million showings, 80 million leads, and 721 million calls, texts, and emails. Three takeaways stand out: it’s time to start planning for Q4 now, pricing needs to be local, and speed-to-response matters more than showing format.
1. Start Planning for Q4 Now
This spring, average days on market decreased to 33 days, the lowest Q2 number we’ve seen since 2022.
What’s more, average rent prices rebounded, increasing by $70 but still remaining a touch below last year’s average price — flat is the new normal. A quarter of units still needed a rent cut to lease.
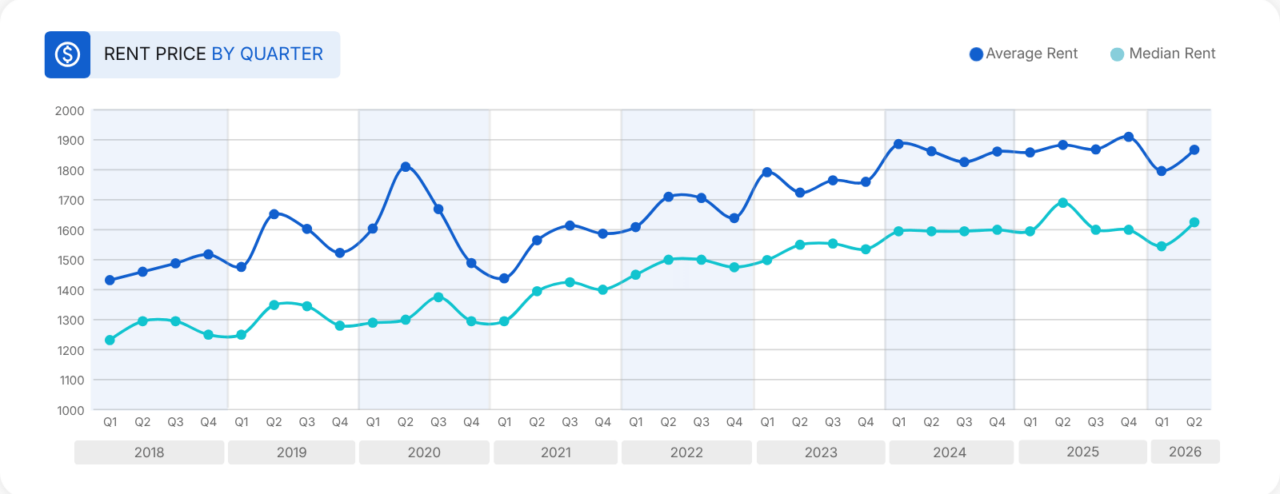
These numbers indicate improved performance for many property managers in Q2, but that doesn’t guarantee a successful end to the year. Historically, average days on market, leads per listing, conversion rates, rent prices, and rent cuts stay flat during Q3.
In Q4, however, performance often cools, as…
- Days on market typically rise by about five days
- Leads drop by around nine per listing
- Rent cuts tend to peak around 35%
Property managers who start planning for that seasonality now will be better positioned to finish the year strong.
2. Benchmark Against Local Numbers for Accurate Pricing
We typically review average numbers from across the United States and Canada during our Data Talks, giving property managers a bird’s-eye view of rental trends happening in North America.
This quarter, we zoomed in further, cutting the data into four U.S. regions, then nine smaller divisions. This revealed interesting variation in the numbers.
Rental Price
The average rent across North America is $1,867. But when we split the U.S. into four regions, we see that average rent ranges from $1,574 in the Midwest to $2,186 in the West, a 39% difference between the lowest and highest averages.
When we break down the West into two divisions, we see even more variation. On the West Coast, the average rent price is $2,484, but in the Mountain division, it’s $1,812.
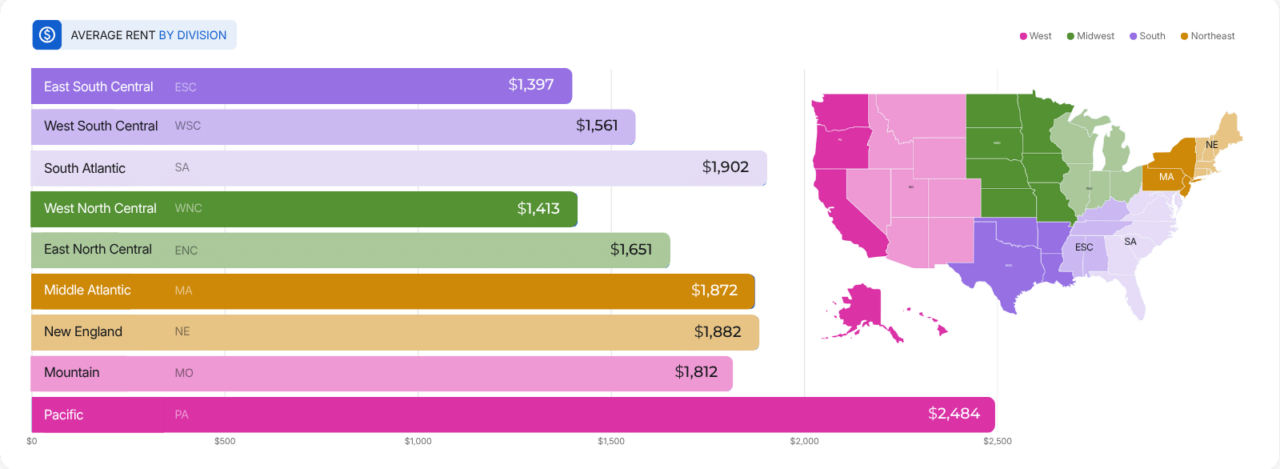
Something else to note: While rent prices varied widely across regions and divisions, conversion rates differed only slightly. Pricing power may be local, but execution is universal.
Rent Bands
Looking at rent bands provided even more insight on pricing at the division level, showing which price points are more or less commonly leased.
In the Pacific division (Washington, Oregon and California), for example, 37% of homes lease at more than $2,500 per month. Compare that to the West North Central division (which stretches from North Dakota and Minnesota to Kansas and Missouri), where only 6% of homes rent at that premium price.
Even inside one region, the split is stark. Within the South region, 31% of units in the South Atlantic division (which stretches from Maryland to Florida) lease above $2,000, but in the East South Central division (Kentucky, Tennessee, Mississippi, and Alabama), that share shrinks to 13%.
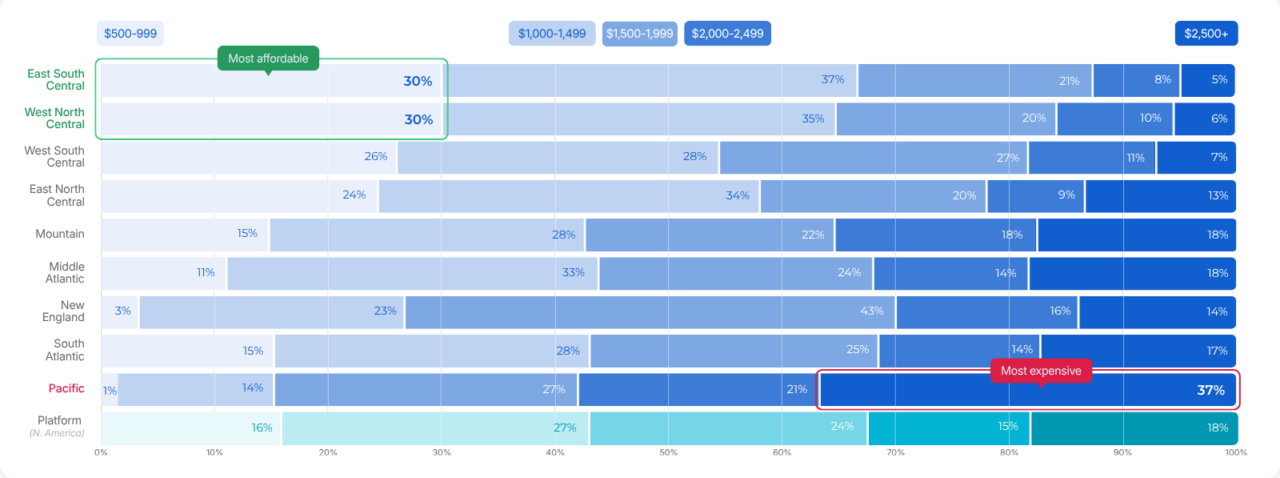
While national averages give an idea of how the market as a whole is performing, these variations show the importance of benchmarking against local numbers.
For the most accuracy, anchor your pricing to your division’s actual rent bands. Competing in a band that your division barely leases in (for example, $2,500+ in the interior South), means you’ll have a thin pool of prospects no matter how nice the unit is.
Price Cuts
One metric that’s universal? Units that need a price cut sit twice as long on the market, regardless of which division you operate in.
Units that were priced right from the beginning leased in 24 – 29 days, while those requiring a cut took 51 – 58 days to lease.
After the final cut, units leased in 17 – 21 days. If, after two weeks on the market, your listing hasn’t met your division’s benchmarks, make a single, decisive price cut to help it move.
3. Speed Matters More Than Showing Format
If you’ve been debating whether self-guided, hybrid, or accompanied showings are right for your business, we have insights that can help you make a decision. It’s not the showing format that matters, but speed-to-response.
Self-guided tours are completed 51% of the time. The completion rate for hybrid tours is 45% and 41% for accompanied tours.
At first glance, self-guided tours appear to outperform hybrid and accompanied tours. But booking speed explains that gap — on average, accompanied tours are booked 68 hours ahead, while self-guided tours are booked only 21 hours ahead.
When we compare tours booked at the same point in the prospect journey, completion rates are roughly the same.
Even more important than showing format is speed-to-response. Leads who schedule a tour within two hours of reaching out complete their showings 64 – 72% of the time. Compare that to leads who don’t schedule a tour until a week after their initial outreach — their completion rates are 30% or less.
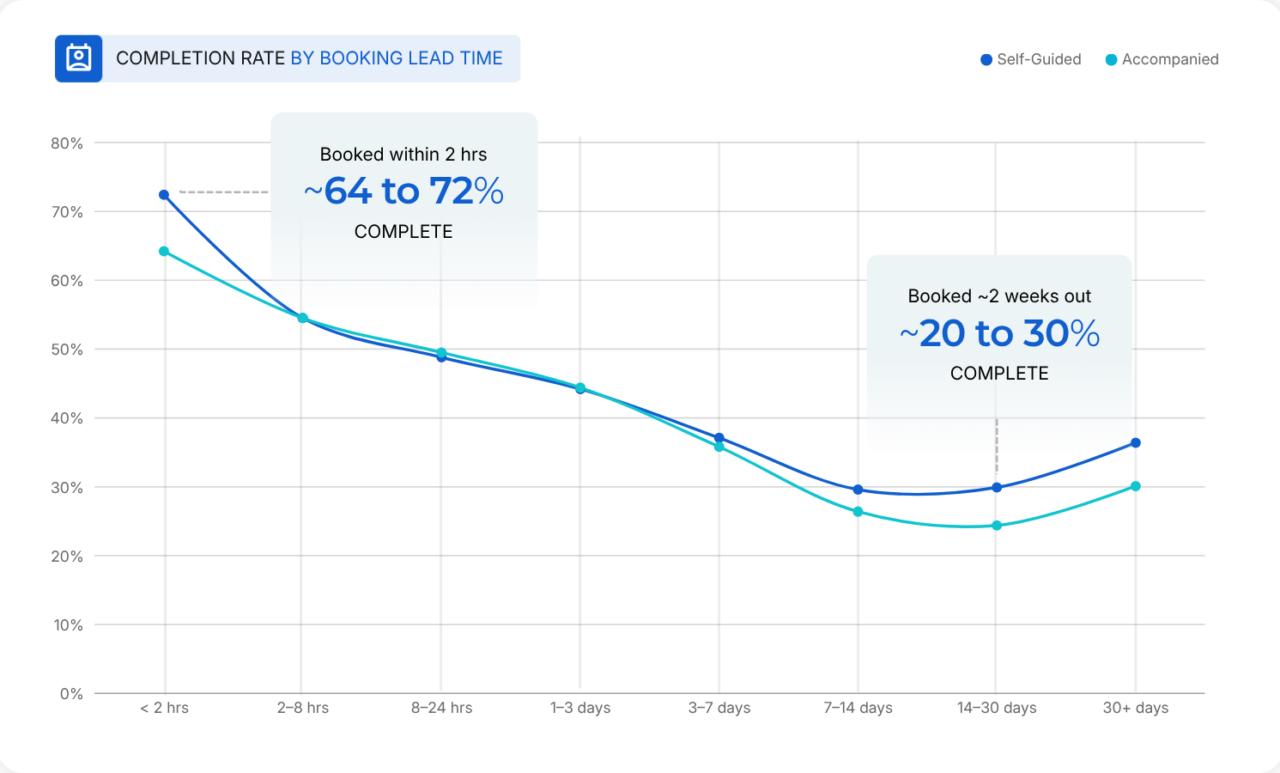
Auto-responses, AI agents, and self-scheduling features turn response times from days to minutes, significantly increasing the odds that a prospect will complete a showing.
These tools are especially important, as most prospects search for rentals outside of office hours, when leasing teams are unavailable to quickly respond to inquiries. More than 60% of conversations with our virtual AI agent, Mo, happen outside office hours.
With Q4 bound to bring a decrease in leads, every prospect you convert now matters even more.
Turn Q2 Insights into Q4 Action
Q2’s data points to a leasing market that rewards preparation, precision, and speed.
National trends can tell you where the market is heading, but local numbers will help you make better pricing decisions. And when a prospect reaches out, responding in minutes instead of hours or days can make the difference between a scheduled showing and a missed opportunity.
Q4 will bring its usual seasonal slowdown. Now is the time to prepare:
- Set price benchmarks
- Strategize for increased days on market
- Remove friction from your leasing process
The strongest leasing strategies anticipate what comes next and put the right systems in place to adapt to future challenges.
For even more data-backed insights to help you finish 2026 strong, sign up to receive a copy of our Q2 2026 Data Talk eBook.
Get Leasing Automation tips and solutions right to your inbox.