Leasing Analytics That Go as Deep as You Need
Track leads, showings, conversions, trends, and owner-ready results from one reporting hub. See performance by property, portfolio, source, and timeframe.
If we’ve got properties with excessive availability, I’ll engage. What’s the issue? What’s the feedback? That way ShowMojo helps us adjust more like an in-flight correction instead of waiting for the plane to land.
Rick Hoegler, President, Pan American Properties
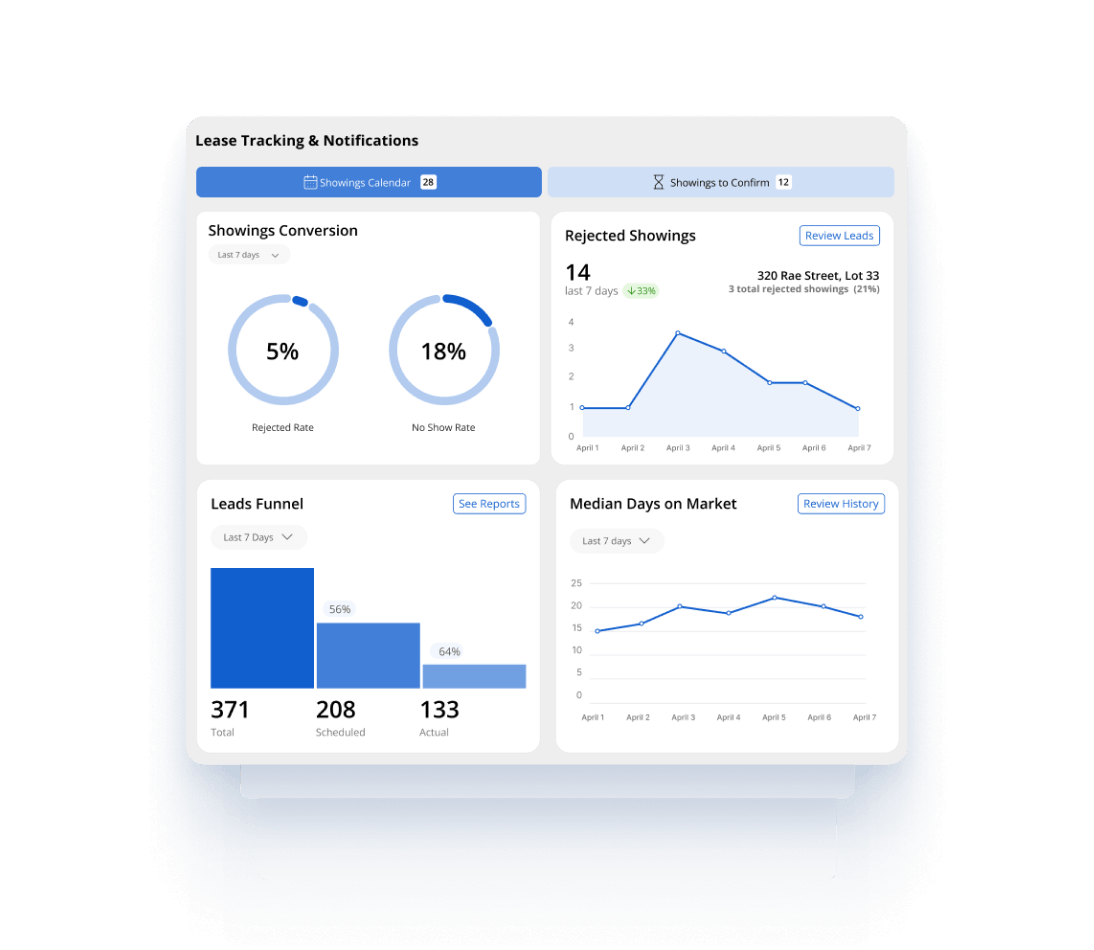
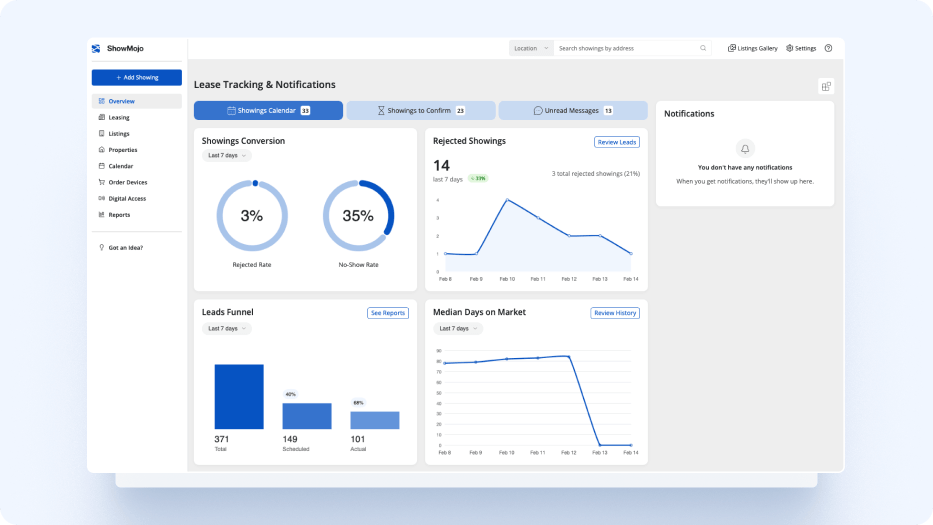
Measure the Metrics That Matter
- Leads captured over time
- Showings scheduled and completed
- Conversion rates through the leasing funnel
- Performance by property or date range
- Filterable views with CSV export
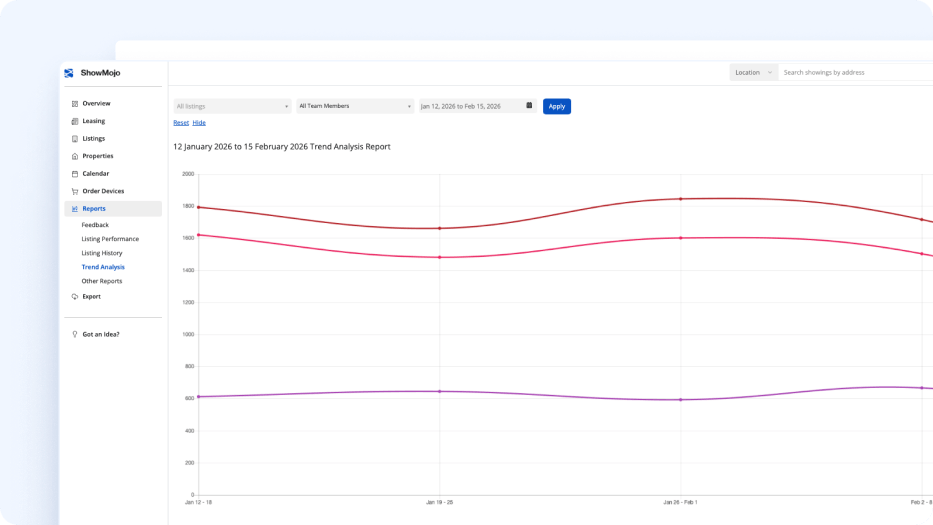
Spot Trends Before They Become Problems
- Time-series reporting for leads and showings
- Identify slowdowns and seasonal patterns
- Compare performance across timeframes to guide decisions
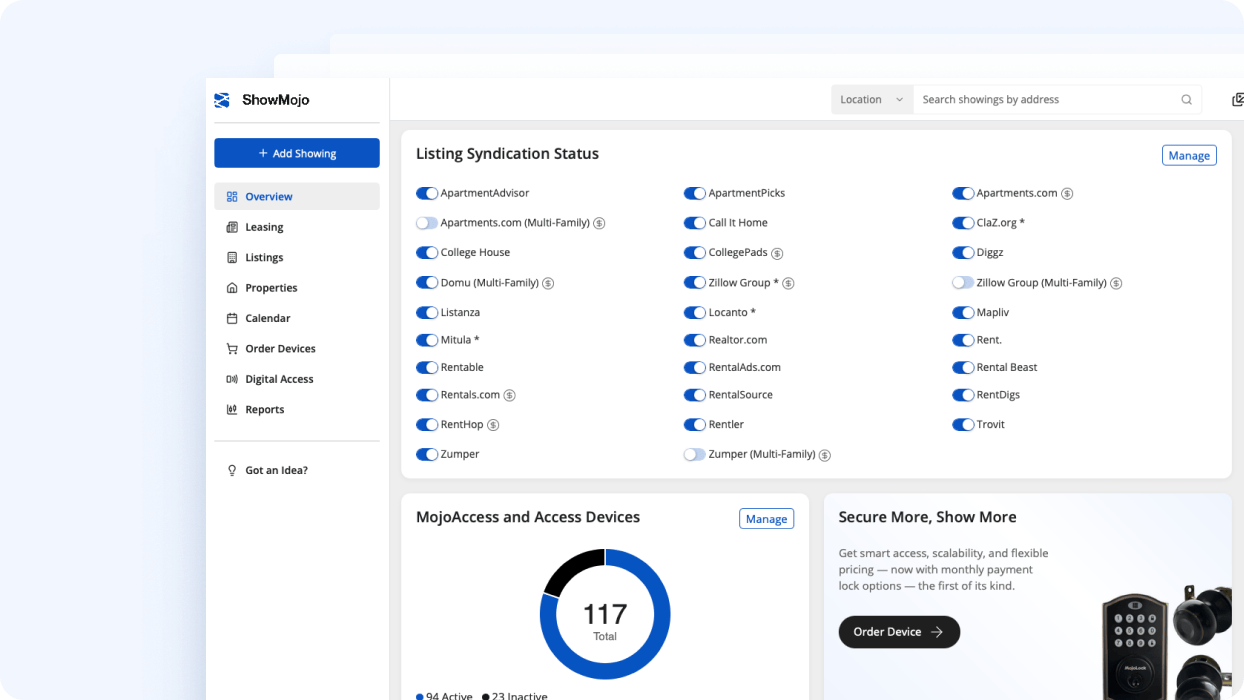
See Which Sources Actually Perform
- Compare performance across syndication partners and manual sources
- Understand which sources drive the most activity
- Use source-level visibility to improve marketing decisions

Segment Performance Reports Across Your Portfolio
Listing Groups make ShowMojo’s reporting more powerful by letting operators separate performance by meaningful portfolio segments, compare results across groups, and see where attention is needed most.
- Report by owner or client
- Report by portfolio segment
- Report by market or region
- Report by showing type
- Report by unit type
- Report by rent range
Keep Owners Informed Without Extra Work
Share owner-ready reports with leasing activity and performance data, send them on a schedule, and add context manually when needed.
It is a more consistent way to keep owners informed without rebuilding updates from scratch.